- 19 October 2026
- in WordPress Plugins
- 81
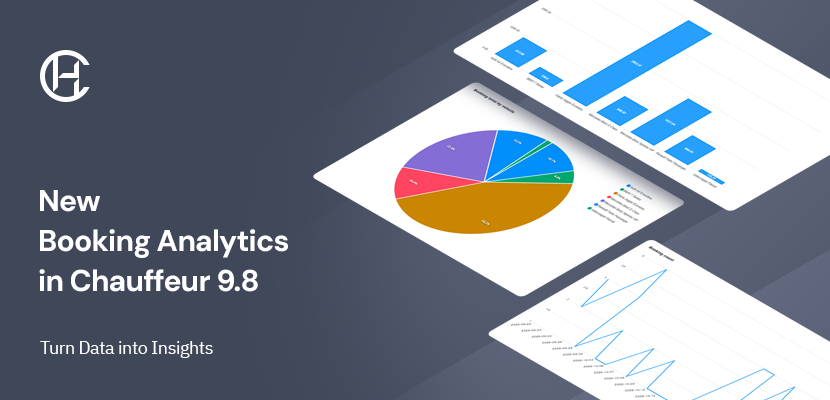
Every booking tells you something about your business. Which vehicles are booked most often? Which routes generate the highest booking totals? How does booking activity change over time?
With the release of Chauffeur Taxi Booking System 9.8, answering these questions becomes much easier. The update introduces a new Analytics module that transforms existing booking data into clear, interactive charts and reports, giving you a better understanding of how your transportation business is performing.
Managing reservations is only part of running a successful chauffeur or taxi business. Understanding what happens across those reservations can be just as valuable.
The new Analytics module lets you explore booking activity from multiple perspectives. You can identify your most frequently booked vehicles, compare booking totals across your fleet, see which routes attract the most reservations, and analyze how bookings are distributed among drivers, service types, and booking statuses.
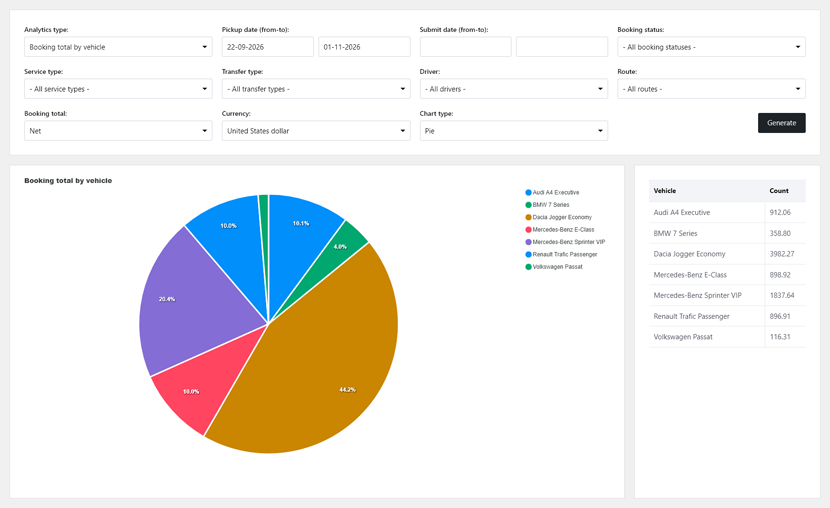
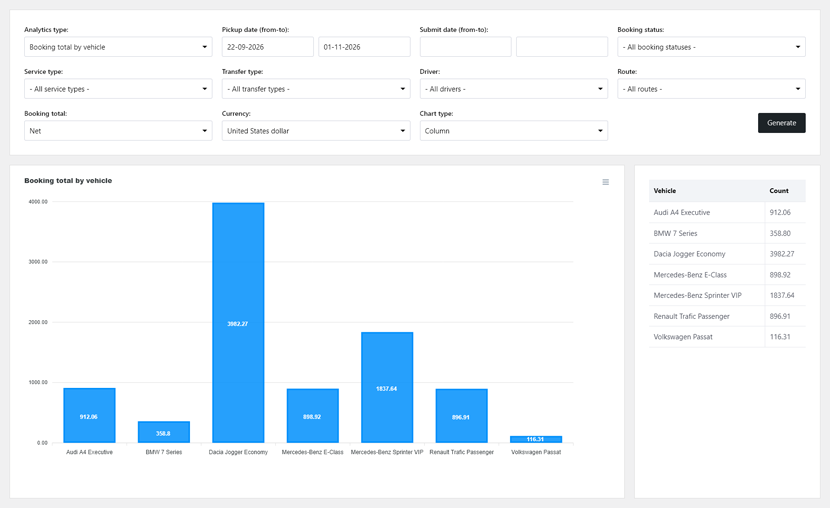
For example, a vehicle that receives the most bookings does not necessarily generate the highest booking value. Analytics makes it easier to compare these figures and understand how different parts of your business contribute to overall results.
The module includes 14 analytics types, covering booking counts, net and gross booking totals, and distributions by vehicle, driver, route, booking status, service type, and transfer type.
Booking activity and totals can also be analyzed over daily, weekly, monthly, or yearly periods, helping you recognize changes and patterns over time.
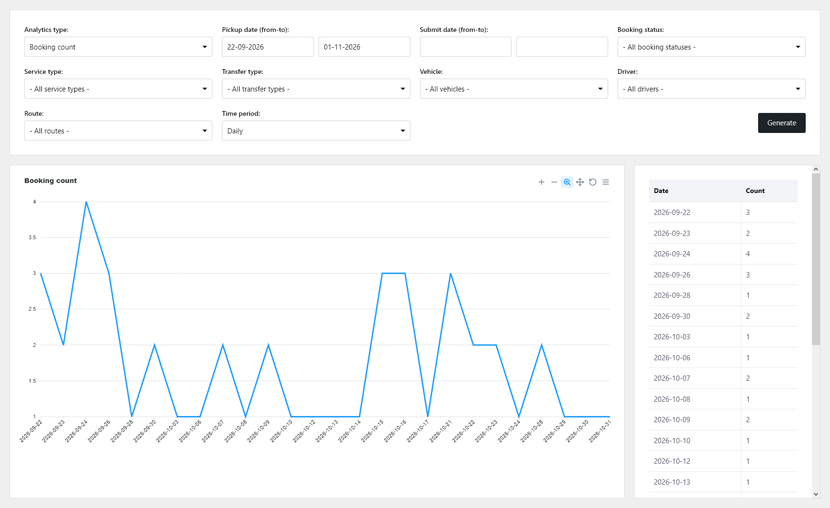
Different questions require different views of your data. Chauffeur Analytics provides flexible filters, allowing you to narrow down results by pickup, return, or submission dates, booking status, vehicle, driver, route, service type, transfer type, and other relevant criteria.
Depending on the selected analysis, results can be presented using line, column, or pie charts. Interactive chart controls also let you adjust the view, including zooming and navigating through chart data.
Need to share a report or work with the numbers outside WordPress? Charts can be exported as PNG or SVG images, while the underlying data can be downloaded as CSV files for further analysis in spreadsheet applications.
One of the biggest advantages of the new module is its simplicity. Analytics is fully integrated into Chauffeur Taxi Booking System and works with the booking information already collected by the plugin.
There is no separate analytics platform to connect, no external reporting service to maintain, and no additional configuration required to start exploring your booking data.
Everything is available directly from your WordPress dashboard, alongside the tools you already use to manage reservations, vehicles, drivers, and services.
Alongside the new Analytics module, version 9.8 introduces several additional improvements:
Chauffeur 9.8 makes it easier to move beyond individual reservations and see the bigger picture of your booking activity. With built-in charts, flexible reporting, and convenient exports, the information you need is now just a few clicks away.
Understand booking trends, compare revenue, and explore your business performance with built-in Analytics. Discover what Chauffeur Taxi Booking System can do for your business.

We create WordPress plugins and themes used by businesses around the world. With more than 15 years of experience and over 125,000 products sold, we focus on building reliable tools that simplify bookings, rentals, scheduling, and online services.


